

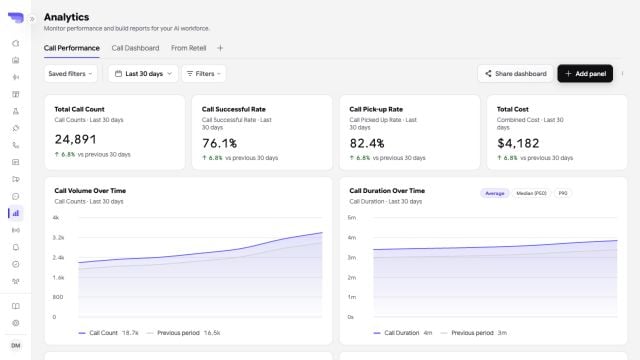
Analytics dashboards combine outcome KPIs with configurable call-volume, duration, and cost panels.
Review analytics
Use Analytics to track live calls, total calls, P50 and P90 duration, answer and pickup rates, transfer rate, average cost, P50 and P90 latency, call volume, dispositions, and duration distribution. Apply the available date and agent filters before comparing periods. Pair aggregate metrics with conversation reviews. A trend shows where to investigate; the transcript and call details show what happened.Diagnose with observability
Open Observability to review:- Voice-to-voice latency at the 95th percentile
- Greeting latency at the 95th percentile
- Tool success rate and error rate
- Voice-to-voice latency by component and model
- Session end-reason distribution
- Tool execution count, success rate, and duration